Digital Environments: Design, Heritage and Architecture
<< Contents
|
Digital Environments: Design, Heritage and Architecture |
<< Contents |
A System for Managing Architectural Drawings as Bitmap Files1
Tim Benton
Keywords: architectural history, architectural drawings, Le Corbusier, Visual Basic, Access.
For more than 20 years, I have been studying architectural drawings by the French architect, Le Corbusier during the 1920s. The Fondation Le Corbusier (FLC) in Paris holds 33,000 such drawings .2
The CORBU database
Over the years, I have developed a database of around 5,900 of these drawings, annotated and sorted into groups. Each group represents a stage in the design of one of Le Corbusier’s buildings (mostly houses). The database began in the 1970s as a mainframe relational database, using the Museum Documentary Association’s GOS system. From here it was translated to different versions of Dbase, and finally to Access.
Figure 1: Underlying structure of database
In its current form, the Access database is structured around three main tables. SHEETS records data pertaining to each physical drawing (Drawing numbers, dimensions, medium, and publication details in the Garland edition of Le Corbusier drawings 3, my photographs, references, etc.).
On any one sheet of paper, there may be one or more 'drawings', understood as distinct designs. These drawings may be one or more measured plans, elevations or sections, or they might be quite casual sketches, or both. The DRAWINGS table documents details of these drawings (their type, my notes on each drawing, their attributed date and the 'Code Group' and 'Code Group Number' I assign to them). Normally, drawings on one sheet can be grouped together in one set of notes. For example, if more than one plan of the same phase of the project is included on the same sheet, there would be little point creating additional records. Occasionally, however, there are drawings on a sheet which represent different stages in the design, and on these occasions it becomes necessary to attribute different code groups to each drawing on the sheet. The DRAWINGS table is related to SHEETS by the FLC number (a five figure number stamped onto each sheet). The 'Code Group' records the stage in the design process of each drawing, according to my analysis. The ‘code group’ field relates to a third table CODE GROUPS which is used to organise the drawings into the design stages for each house. The CODE GROUPS table therefore has a code (e.g. SAVAO1), the name of the project, the dates post quo and ante quemand the code group description. The group of drawings in each code group has a common description and the code group number identifies the number of the drawing within each code group. The database can therefore print out all the drawings for a project in their code group order, which is normally a chronological order.
In addition, a separate table of notes on associated archival documents can be linked in via an optional Code Group field. A selection of related data for drawing FLC 19743 (Code group PES:D02/3) is shown below.
Figure 2: Form showing the Drawings, Sheets, Codegroups, Documents and Images table
In my book Les Villas de Le Corbusier 4, a digest of this database was printed out as an appendix in its minimal form (code groups and drawing number only). Two generations of researchers at the FLC have used this as a starting point for their investigations of these houses.
Organising high and low density images of Le Corbusier drawings
The FLC does not permit researchers to study Le Corbusier’s drawings directly. Instead, researchers are provided with Kodak microfilm cards, which include a 35mm black and white negative image of each drawing. A few drawings are reproduced in colour. Over the years, I have amassed, with permission, a collection of some 6,000 transparencies of these microfilm cards of very varying quality. Last year I began to scan these onto CD-ROMs, and the problem presented itself of how to organise the files, how to relate them to the database and how to manipulate the images in a useful way. Experimenting with the image handling capabilities of Access quickly persuaded me that another route would have to be found. Furthermore, to be useable, most of the drawings required scans of from two to five megabytes each. These are 256 gray-scale images with the colour information thrown away.
I therefore turned to Visual Basic as a compromise between ease of linkage to Access and flexibility of programming. I devised a system to link the database to files in a folder on any medium (hard disk, floppy or CD-ROM). The path of every drawing is stored in the Images Table, enabling the filebox to be interrogated for the filename which corresponds to the FLC number. Alternatively, the filebox can be browsed; double-clicking on the filenmae is sufficient to load it.
Figure 3: Detail of main form of DRAWINGS program
Extracts from the SHEETS and DRAWINGS tables are included on tabbed panels (bottom right).While the Database finds the drawing records by their number (e.g.: 19743, the key field), the program finds the corresponding image file (19743.bmp) by getting the path from the Images table and interrogating the file directory for the filename. The drawing can also be loaded directly from the files list, so any image new to the system can be easily added. The drive and directory pathname is automatically stored in the database in the IMAGES table (bottom). A set of drawings located on CD ROM in a directory E:\PESSAC\ can be moved onto a hard disk directory C:\Users\Cdrive1\PESSAC for speed of working, and so that the drawings can be manipulated and changed. Later, they can be burned in on a new CD-ROM. A single Update Query can change the drive and directory details in IMAGES to the CD-ROM path, for the whole batch of drawings.
An inconvenience of working with Visual Basic 4 is that it cannot handle the common compressed file formats, preferring the full .BMP image files. The drawings for the larger projects, such as Pessac, fill two CD-ROMs. The drawings take a few seconds to load. This works well for loading one drawing at a time, when I would expect to work for several minutes on each drawing. It soon became clear that a system of thumbnails would be required for rapid visual scanning of the drawings. The problem of thumbnails can be resolved by creating a sub directory onto which can be copied reduced versions of the large image files. I chose a fixed height of 180 pixels, with the width pro rata, since this was the smallest size at which most drawings could at least be identified .5 This produces files of between 50 and 70 K. My program (TABLE) allows up to ten drawings to be worked with on the screen at a time, for sorting or selection purposes. There are two advantages to this system. Firstly, these "super thumbnails" can be loaded quickly one after the other when searching or sorting. Secondly, a very large number of drawings at this density can be stored in one directory on the hard disk. I will eventually have these "super thumbnails" for all the drawings in my database in one directory on the hard disk.
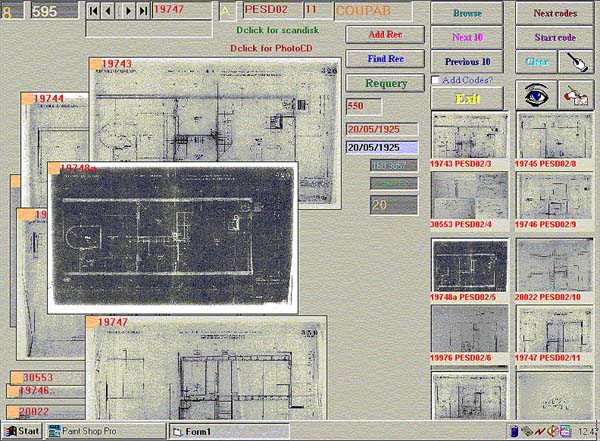
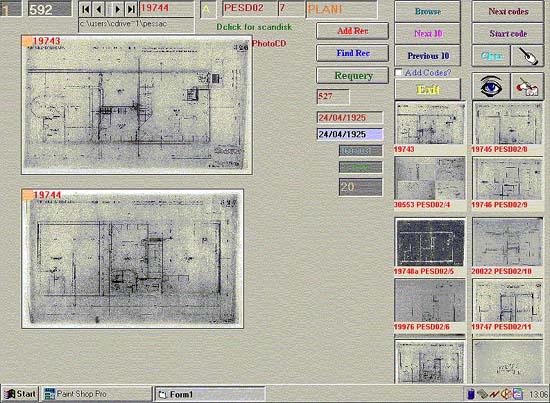
Figure 4: Screen shot of main form of TABLE program
The index number of the 'super thumbnail' (from 0-9) is recorded top left and the index number of the drawing in the file list in the box next to it. Thus, the drawing with the focus (FLC 19746) is No 6 in the array of ten and the filename is 594 down the list of Pessac filenames. To scan through a set of drawings quickly, I can either scroll through the directory ('Browse' command), find an individual drawing by number or find a group of drawings by the Code Group on the database. I can then call up either one, or the next ten, drawings, either in order of their FLC numbers ('Next 10') or in the Code Group order ('Next 10 Codes'). The 'Writing hand' icon will call up the description fields from the Sheets, Drawings or Images tables. The 'super thumbnails' are represented along the right side of the screen in two columns of five icons, with labels identifying the FLC number and the Code Group and Code Group number. Double-clicking on any of these will place them at their full size in the viewing area on the left, where they can be moved around, minimised to a thin strip or cancelled. A dynamic array keeps track of up to ten drawings in the 'super-thumbnail' format in the viewing area, while any number of icons can be surveyed, ten at a time, on the right. This is designed to allow me to accumulate up to ten drawings from the entire set and to make notes on them, change their Code Group details and so forth. Clicking on any of the images and pressing the 'Eye' button finds the associated reference image and displays it at full size for close inspection or comparison (see below).
Working with bitmap architectural drawings
The purpose of scanning drawings and working with them on screen is to try to reproduce the benefits of working with original drawings and gain some additional advantages. The key tasks are: inspecting the drawings at the maximum available magnification, manipulating the drawings (rotating, reversing or flipping the image for comparison with another drawing, comparing drawings, establishing a scale and being able to measure on drawings, sorting, grouping and scanning large numbers of drawings).
In practice, I work with drawings in two main ways, for which I have designed two different programs: DRAWINGS and TABLE. The DRAWINGS program is used for a preliminary inspection of each drawing during which I make notes as objectively as possible about the drawing content. I normally work through all the drawings for a project one by one in number order, without attempting any interpretation or sorting. During this pass, I aim to perform the following functions:
- identify the type of drawing (plan, elevation, bird's eye view, etc.),
- transcribe significant text and labelling,
- establish a scale (both the scale of the image to the drawing and the scale of the drawing to the building)
- establish overall and significant dimensions,
- make notes about any aspects of the drawing which seem interesting or peculiar.
Defining a scale for each drawing and making measurements
Figure 5: Drawing FLC 19918 in super-thumbnail form.
Most of these drawings do not have annotated dimensions, nor a scale, nor did the photographers usually include a usable ruler or scale in the image. The students who wrote the card index details of the drawings in the 1970s measured each drawing. This should allow us to compare these dimensions with the pixel width and height of the image. Unfortunately, the drawings are rarely rectangular and their measurements are only approximate.
I needed to devise a quick and simple way of estimating a scale, which would allow for iterative refinement, as more information became available The approximate drawing dimensions are enough to establish a preliminary dialogue to work out the scale. The system I developed depends on establishing a reference image (at the 1:1 pixel count of the scanned image) and relating any other zoomed versions of the image to this reference. I distinguished between a 'Building Scale' which records the number of pixels in the reference image per metre in the building represented and a 'Screen Scale' which records the number of pixels per centimetre on the drawing. I can establish these two scales, along with the 'Drawing Scale' (the scale of drawing to building dimensions), with a 3-point interrogation which prompts for
- Dimension (which might be in centimetres on the drawing, e.g. sheet dimensions or in metres in the building represented).
- A Drawing Scale (e.g. 1:50) which can usually be guessed
- An answer to the question "Is this a measurement in metres on the building or a measurement in centimetres on the drawing?"
Following this interrogation, the ‘Building Scale’, ‘Screen Scale’ and ‘Drawing Scale’ are recorded on the database for the record in the Images table linked to the relevant sheet.
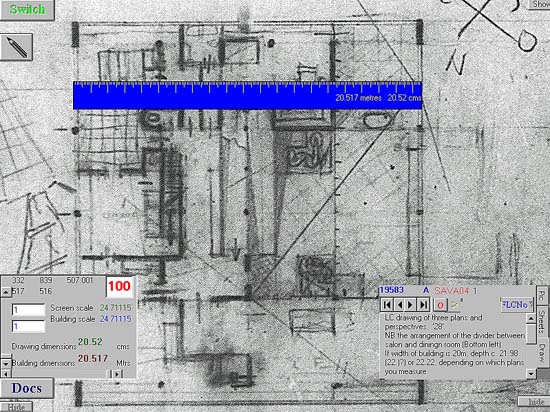
Figure 6: Screen shot of DRAWINGS program
Measurements are made in the DRAWINGS program with CTRL-left button and SHIFT-left button commands, which record the x and y positions and then calculates the distance in pixel s between them (top left in the inset panel at bottom left). Using the Drawing Scale (1:100) and the screen and building scales (both 24.711 in this instance), the program calculates the dimension in centimetres on the drawing and metres on the building (20.52 in both cases). A blue ruler records the dimension, and this ruler can be moved around the screen to make other approximate measurements.
As the dimensions of parts of the building or the site become known, from experience, it becomes increasingly easy to establish the scales. It is essential, however, not to make hasty assumptions, since in some cases the only thing which distinguishes parts of the building in one design stage from another are minor changes in the dimensions. It is important, therefore, to check the dimensions of the sheet at each stage. But as the recognisable design stages emerge, it becomes possible to make the building scale much more precise (to the nearest pixel) by knowing the exact dimension of a plan width or depth or height. The scale interrogation procedure is triggered whenever the building scale is reset to 1 and this makes it very easy to continuously refine the scale.
Theoretically, measurement on bitmap files carried out on images viewed at the real size can be pixel perfect. In practice, neither the original images nor the copies I made are perfectly zenithal, nor are the drawings flat. Folds and creases in one dimension can distort measurements in that axis to a remarkable degree. Nevertheless, error margins of better than 1% can be expected. This is an improvement on working with the microfilm reader at the FLC where, despite the very high quality of the original microfilms and the reasonable projection quality of the reader, distortions in projection and the difficulty of measuring on a backlit screen counteract the advantage of a superior image.
The DRAWINGS program
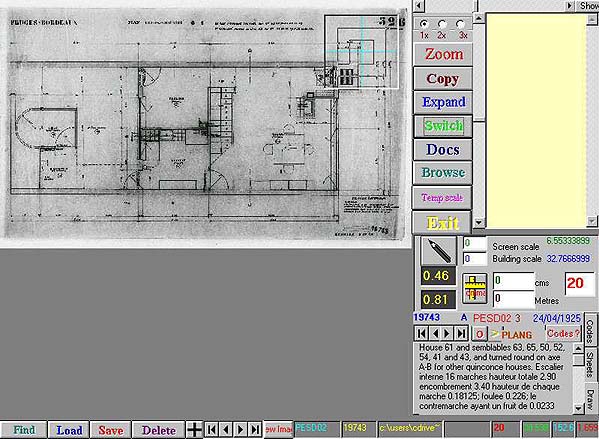
Figure 7: DRAWINGS program, main screen, showing a drawing scaled to the viewing area
The working environment for the "first pass" examination of the drawings is a program called ‘DRAWINGS’ (see above). Since this comes at the beginning of the process, maximum flexibility for loading the images is provided. The drawing can be loaded by interrogating the database (tabbed panels bottom right) or from a drive, directory and file tree (Command 'Browse', cf. Fig. 3). The image is loaded as a reference image (i.e. 1:1 on the scanned image), but it is shown in the first instance as a reduced copy, scaled to a square viewing area (on the left). It is important when first examining a drawing to be able to see it in its entirety. To aid closer examination, a "magnifier" is provided (top right). This is in Visual Basic terms a picture box which can be moved round the image at a zoom scale of 1:1, 1:2 or 1:3. The detail shown in the magnification box is part of a version of the reference drawing stretched according to the zoom factor and aligned accordingly.
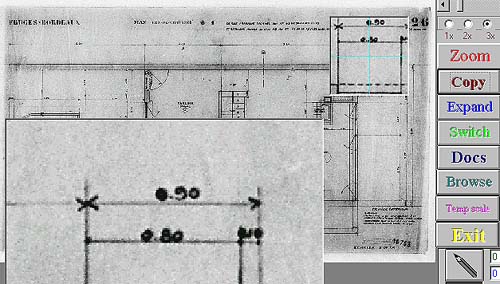
Figure 8: Detail of Drawings program, showing the use of the magnifier (top right) with the magnifier zoom set to 3:1, and the enlarged detail produced by the COPY command (bottom right)
At any of these zoom rates, the portion of the image in the magnifier (plus 20%) can be enlarged to a 300 x 300 pixel box (bottom left), for identifying bits of writing or interesting details and making preliminary notes on these.
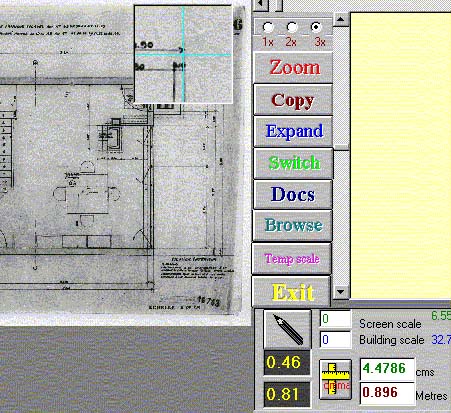
Figure 9: The magnifier (top centre) used to measure dimensions, expressed (bottom right) in centimetres on the drawing and metres (0.896) on the building (accurate to 0.004m).
The magnifier can also be used as a measuring tool, quickly establishing an approximate scale by reading the dimensions of the drawing. A quick check can be made by comparing the width and the height dimensions. Usually these are incompatible, typically because the students smoothed out the drawing when they took their measurements. Cross hairs in the magnifier define the measuring point, which can be inched to the nearest pixel with two slider bars.
If there are any written dimensions on the drawing, these can also be used to refine the scale. The dimensions of the drawing, derived from the SHEETS table, are recorded for easy reference (0.46 x 0.81). The screen scale and building scale can also be consulted, and a refinement of these can be triggered by resetting the Building scale to 1 and performing a new measurement.
For a freer and more uncluttered view of the reference image, the 'Switch' command places the viewer on the reference drawing. This image will typically be at three to four times the size of the screen and will be at the optimal resolution for the scanned file. The building and screen scales (pixels per metre and per centimetre) are recorded in the database as they apply to this reference image, but the smaller scales of the image as sized to the square box in the main form are automatically calculated and transferred, so that measurements can be made on both screens.
Navigation is by [ALT] left button controls on the mouse. Hold down ALT and left button and 'fly' in the direction you want to go. This is the opposite of the ‘hand’ tool used in some graphics programs, which I find counter-intuitive for large image files.
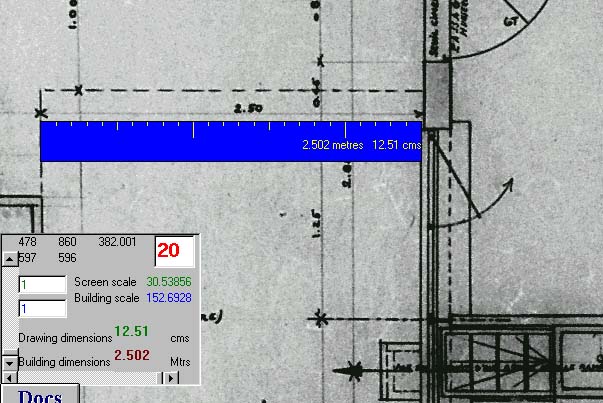
Figure 10: Screen shot switched to reference image in the DRAWINGS program, showing the use of the ruler to measure 2.50m as indicated on the drawing.
Here the image is at the reference size (1:1 to the scanned image). A 2:1 enlargement of a segment of the image can also be obtained with a shift-Right button click. Measurements in this view can be made with the shift and control left button clicks on the mouse. The ruler in Visual Basic terms is a picture box, which re-draws itself, using the scale function to match the dimension measured. A limitation in Visual Basic means that the box can only be vertical or horizontal, but it is nevertheless a useful and intuitive device for estimating approximate dimensions quickly and easily. The control panel on the left can be made visible, to change the scale at any point.
The TABLE program
A second stage of organising the drawings involves sorting and grouping to work out the successive stages of the design (Fig. 11). Although it would be perfectly possible to load more than one image into the DRAWINGS program and switch between them, the time penalty would be quite severe. I therefore used the "-S" directory to load the smaller files in more quickly.
The screen is set up to load ten thumbnail images at a time, either in number order or in the order of the code groups. To call up the reference image of any of these images, the thumbnail image has to be made active and the switch ('Eye' icon) command button pressed.
Figure 11: Screen shot of TABLE program, showing ten icons loaded on right, and two drawings selected for comparison.
This switches to a screen similar to that of the reference view in DRAWINGS, with the drawings at the full 1:1 scale (Fig. 12). Movement and measurement can be made in a similar way (but without the ruler).
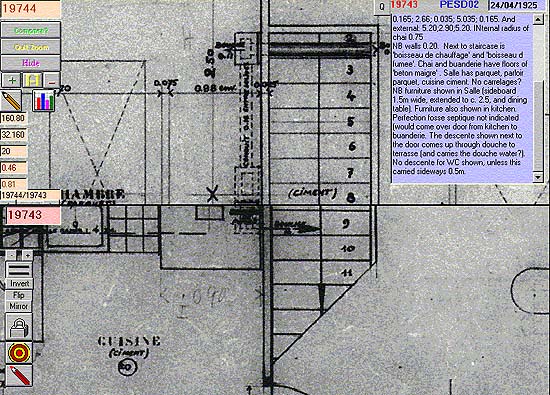
Figure 12: Screen shot in TABLE program switched to reference image.
The scale can also be adjusted by small fractions up and down ('+' and '-' buttons). The Pencil button puts the drawing into Photoshop while the adjoining button calls up the calculator. The bottom field records any drawings with which this ne has been compared. The writing hand calls up the notes fields.
Comparing drawings to scale
Since every image that has had a scale attributed to it can be compared to any other, it is possible to introduce a 'Compare' command. Comparing images in Visual Basic is made more difficult by the lack of bitmap layers. I experimented with a system of virtual layers using the 'Paintpicture' command. This required superimposing two images in real time and giving the illusion of moving one across the other. Unfortunately, it proved impossible to create a realistic result without considerable manipulation of the original drawings (for example, reducing them almost to line and colouring them in contrasting colours). Instead, a split screen method seemed to work better.
Figure 13: Comparison of two drawings (FLC 19743 scaled to FLC 19744), lined up and locked (padlock button). Both drawings now move together, if controlled from the bottom drawing, or independently if controlled from the top drawing. The information box (top right) shows the description boxes for the Sheets, drawings, images or codes tables (toggled by double-clicking), relating to whichever of the drawings has the focus.
The 'Compare' command calls up a second drawing, and scales it to the first, using the building scales of the two drawings to stretch or shrink the second image. The drawings can be lined up and then locked, with the Padlock button. The database stores the co-ordinates, and the Target button will then realign the two drawings.
Figure 14: TABLE program with vertical split.
The Compare command can be used with a horizontal or vertical split. Switching from the horizontal to vertical split and back preserves the point of synchronization. The screen can be cleaned up with the Hide command (toggles with 'Show' label). Every time the Lock command is used, the program records whether the split was horizontal or vertical at the time, and the Target button will then reproduce the conditions pertaining when the Lock button was pressed.
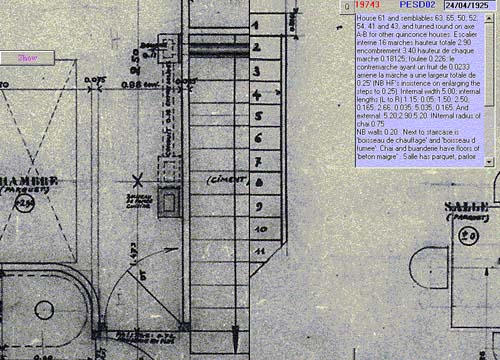
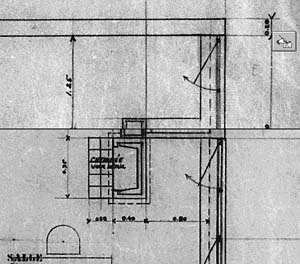
Figure 15: Detail of comparison of ground and first floor plans, showing chimney flue
For example, in the example in Figure 15, the positioning of the chimney flue on the first floor can be compared with the positioning of the flue and fire place below. Minor differences, omissions and alterations are quickly shown up, using the eye’s ability to detect pattern and shape. The windows can be split horizontally or vertically. The image in the lower half of the split screen can be flipped, inverted or mirrored, but not rotated by small amounts. For this, Photoshop is required.
I have begun to use this method in teaching. However, I have discovered some problems. The pace at which one moves the synchronised images is very personal. I have found that students who are amazed by the system when they are in control find it bewildering when it is manipulated for them in a seminar. On the other hand, the ability to move across a drawing in close up and point to things is of fantastic benefit in teaching. The potential of allowing students to take measurements on architectural drawings is a significant breakthrough. And this approach could be extended to any kinds of bitmap images, of paintings, photographs and prints.
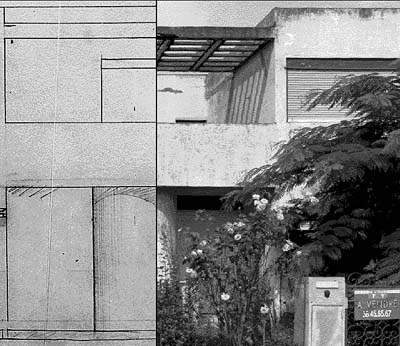
Figure 16: Comparison of elevation drawing and photograph
Any reasonably straight photograph can have a scale attached to it and be treated just like an elevation drawing, bearing in mind distortion. Comparisons between photographs and drawings can, nevertheless, be extremely revealing in drawing attention to changes in construction.
NOTES
1.This paper was presented to the CHArt conference in Glasgow, September 1999. I would like to emphasize that the programs described here have evolved in a working research environment over the last eighteen months, serving the practical purposes of annotating and analysing drawings. I have not benefited from any help with the design or programming.
2.The Fondation Le Corbusier, 8 square du Dr. Blanche, 75016 Paris. The originals of the drawings illustrated here are copyright of the Fondation Le Corbusier and are not to be reproduced without permission.
3 H. Allen Brooks (1982-), (ed.), The Le Corbusier Archive, 32 vols., New York, Garland Publishing Inc. and Fondation Le Corbusier.
4 Benton, Tim (1983), Les Villas de Le Corbusier, Paris, Philippe Sers, (1987), English edition by Yale University Press.
5. Photoshop 5 allows this process to be automated with batch processing.